Platform UI Tour
This document provides a quick tour of the Platform User Interface (UI) describing each item of the Navigation Menu from top to bottom in case of already established contract with working integration flows.
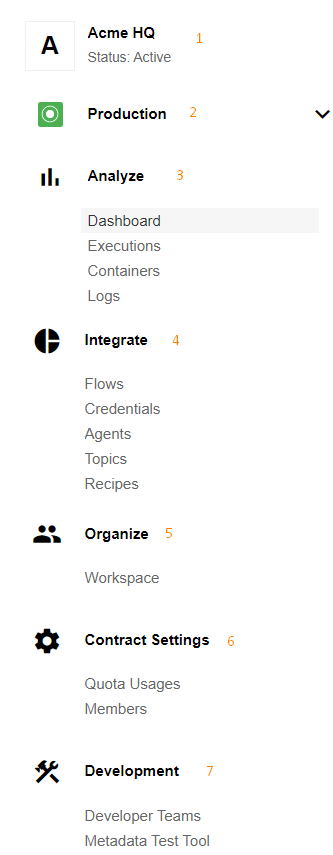
Menu structure:
Click through each menu section while you reading this tour since you might see slightly different picture based on your access level and the project stage in your contract.
1. Contract name and status
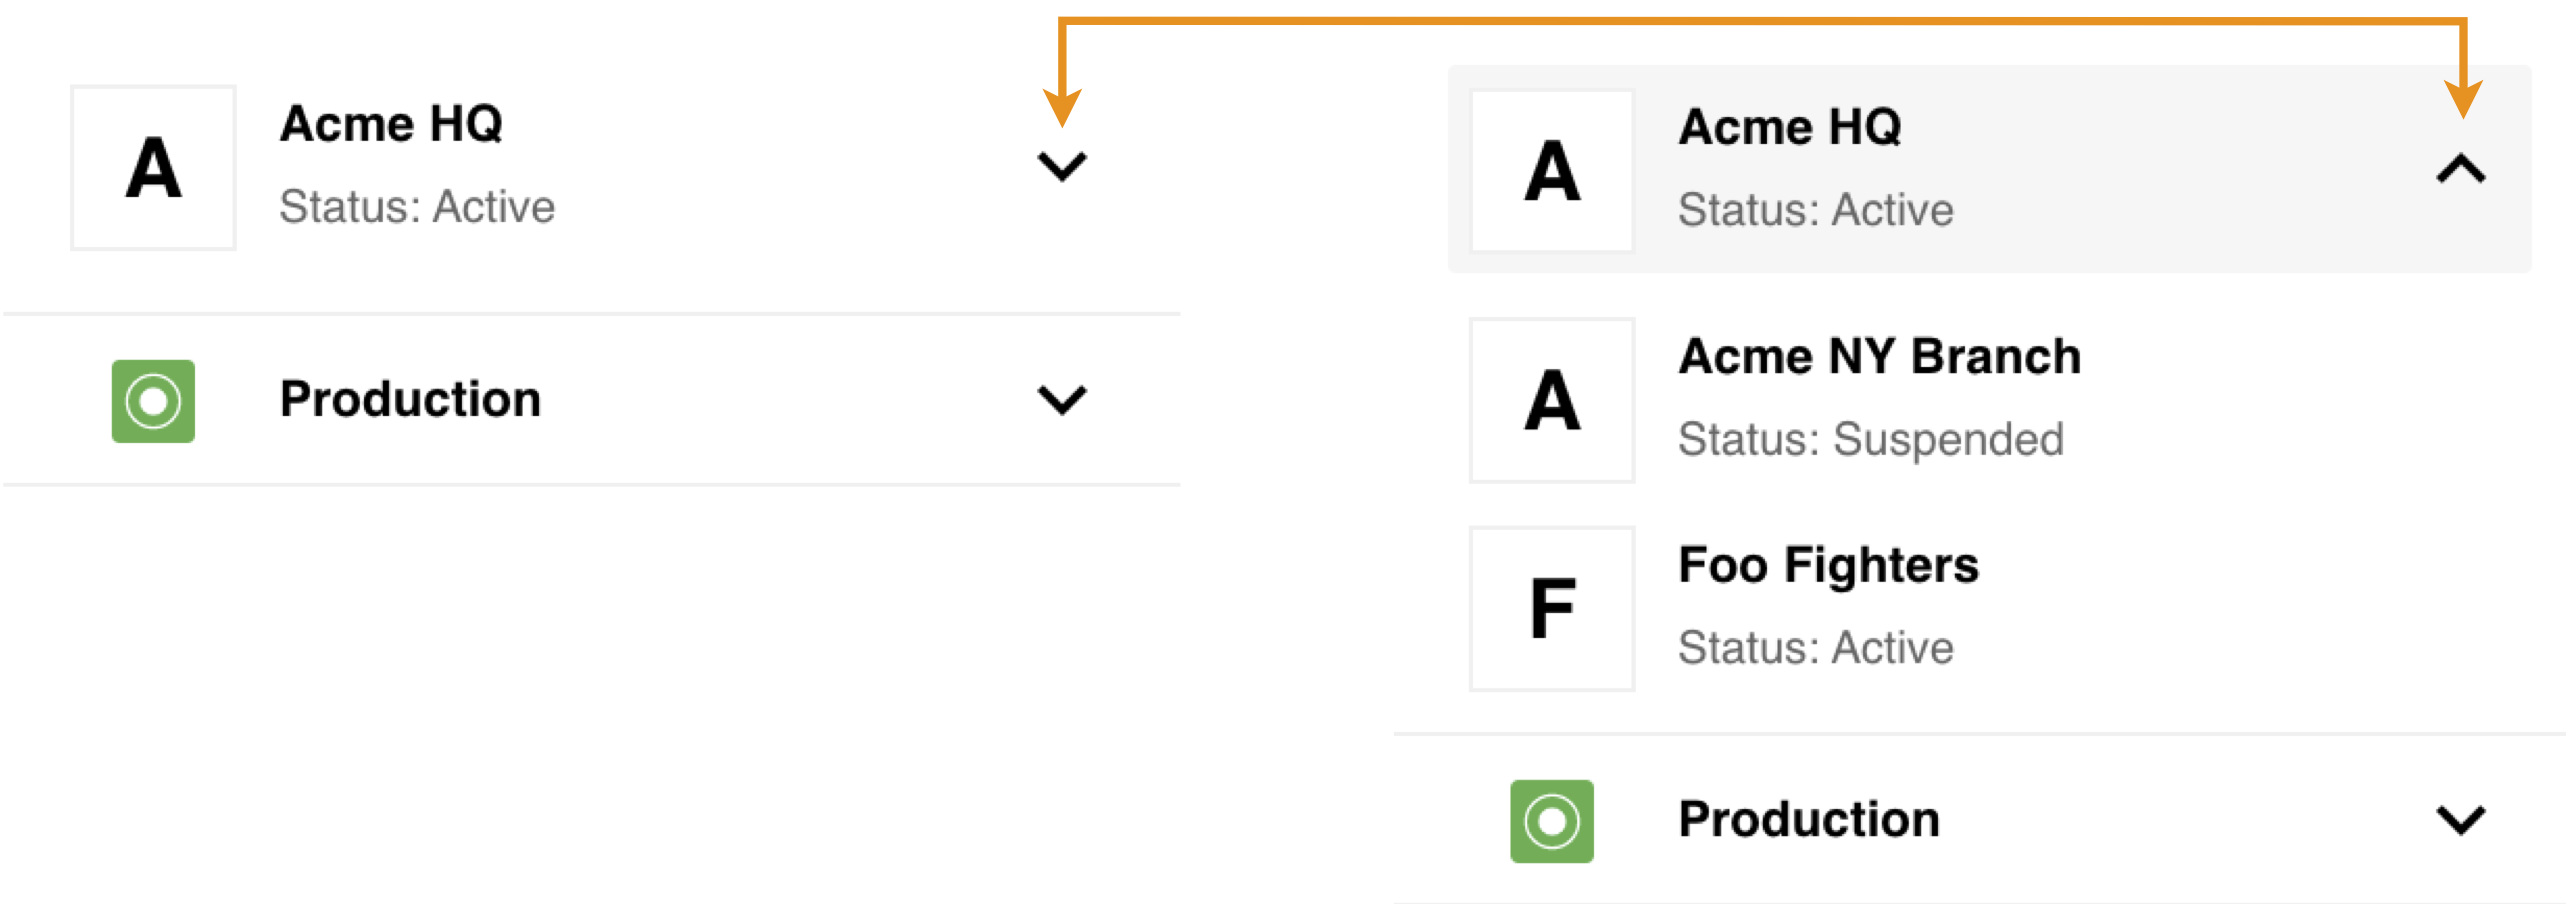
At the top of our navigation menu you can find your contract name and the status. Contract status shows state of the contract - Active or Suspended.
If you have access to more than one contract on our platform you will also see the chevron icon which you can click on to open list of your contracts. Select the name to switch to a different contract.
2. Workspaces
This part of the menu shows the current workspace. Click on the chevron icon to open a sub-menu containing list of the workspaces you can access in the current contract. Select the name to switch to a different workspace.
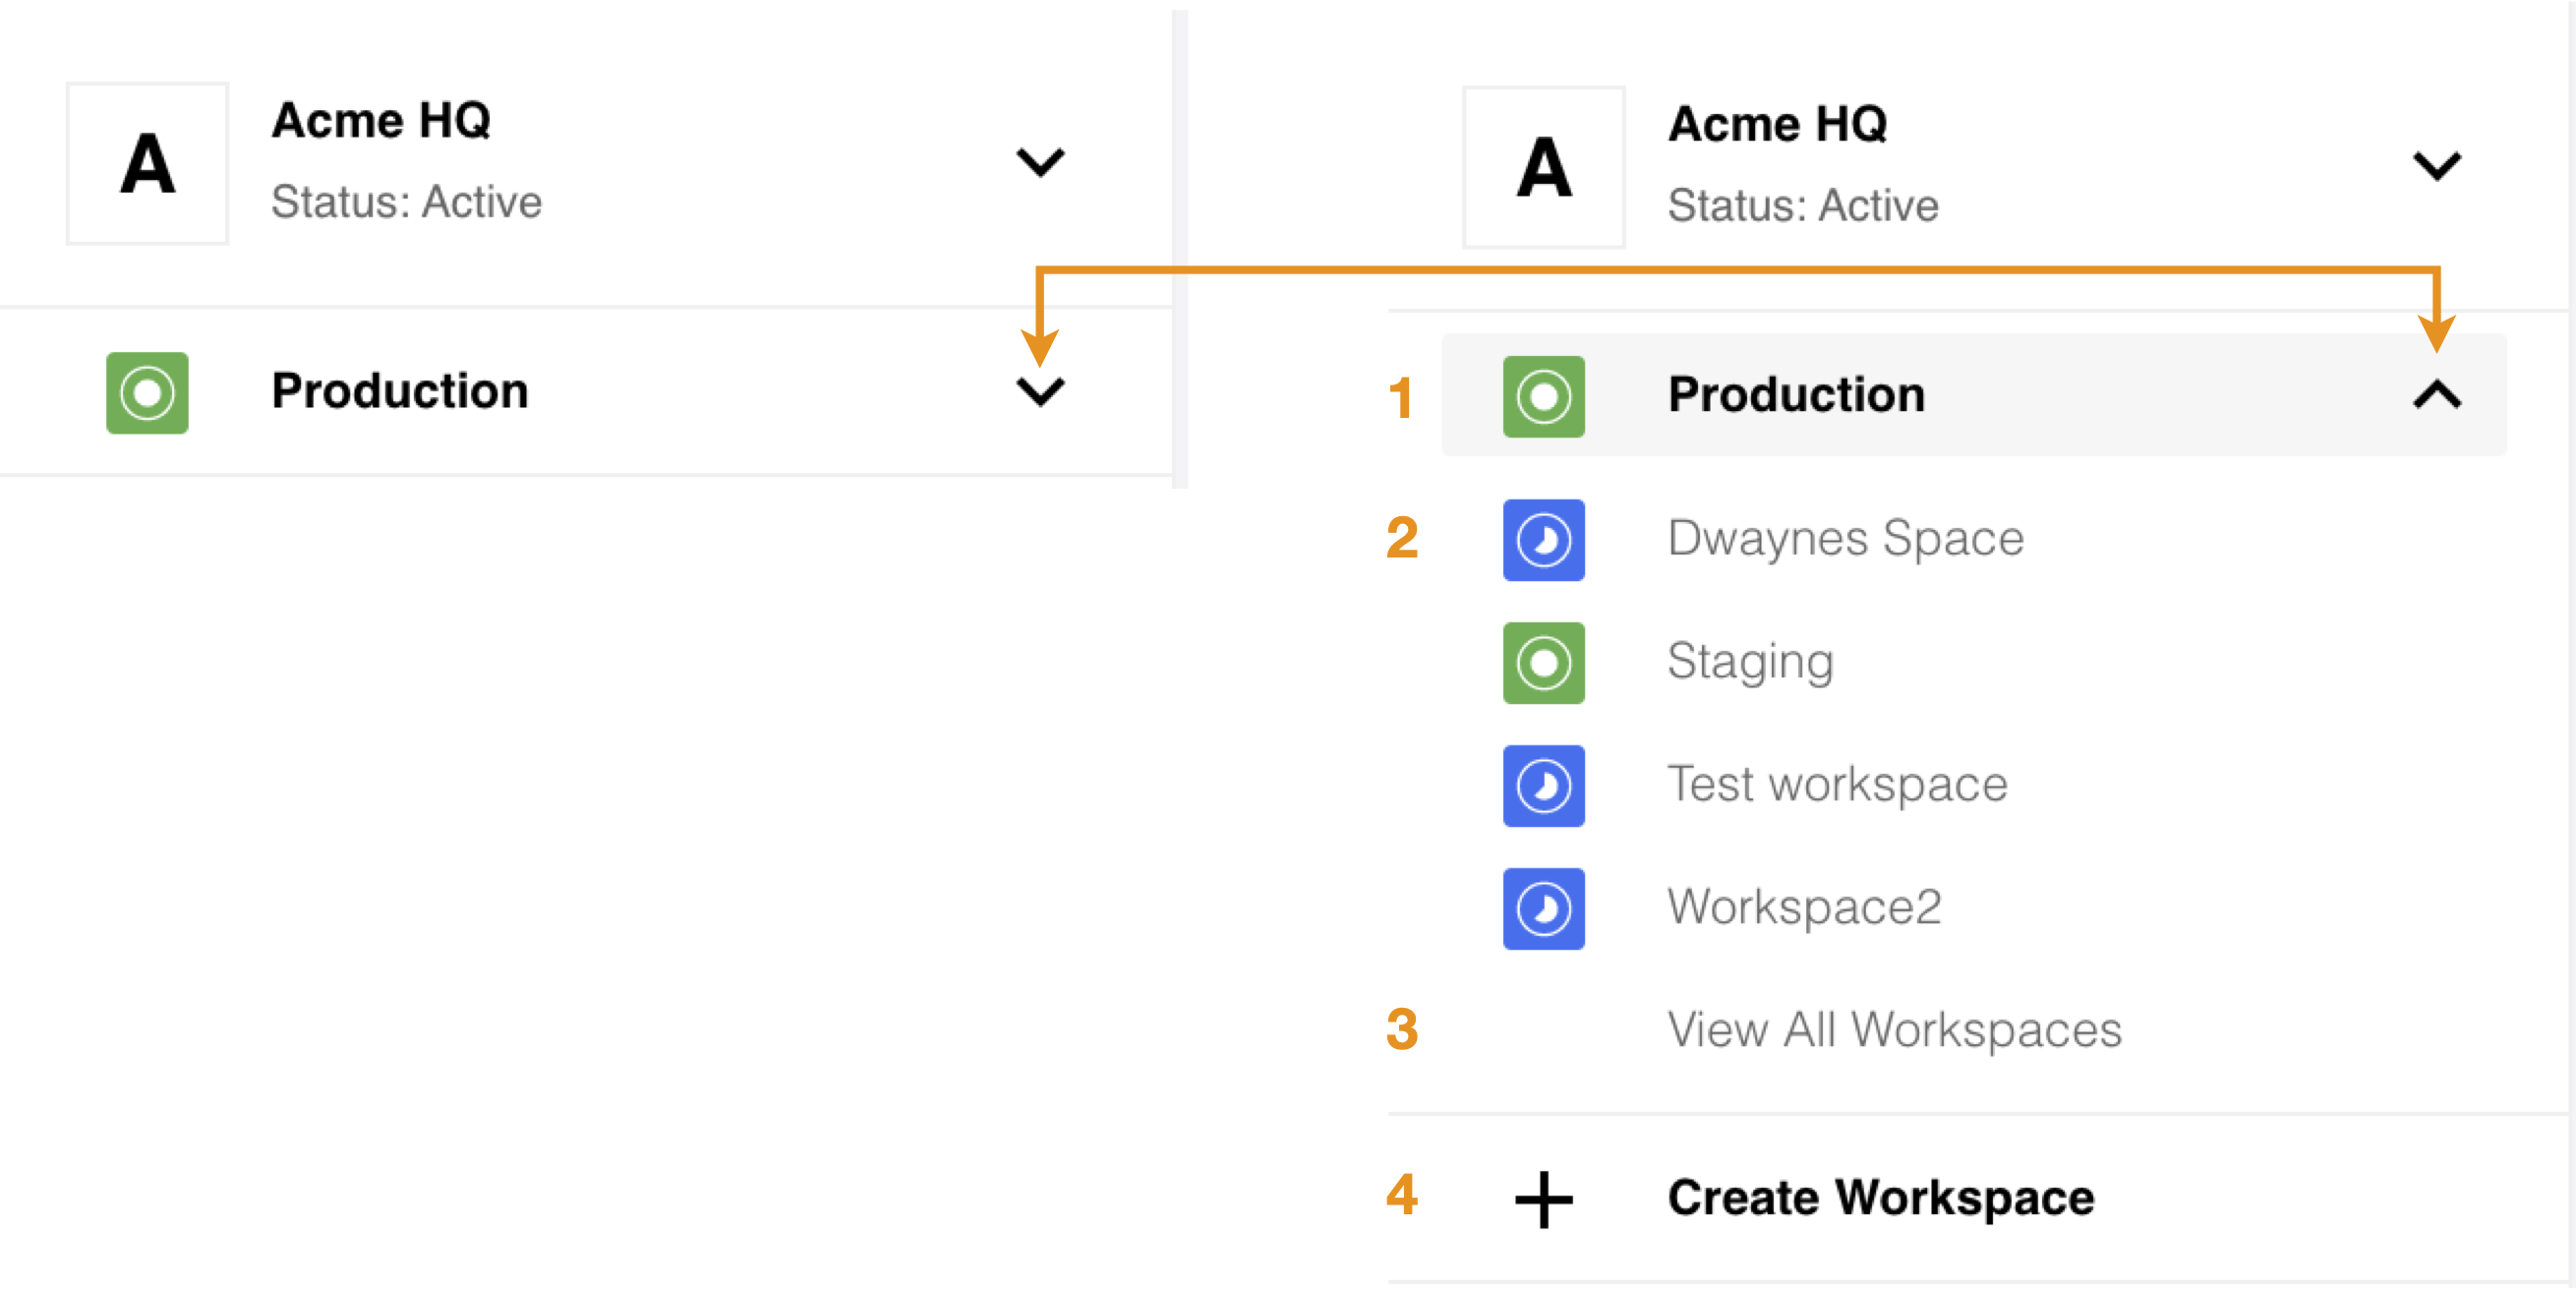
The open workspaces sub-menu on the right shows the following details and menu items:
- Production or
fullworkspace used for production flows. - Development or
limitedworkspace used to develop integration flows and run tests. - Menu item to View All Workspaces in the contract.
- Menu item to + Create Workspace.
3. Analyze
This menu section links pages to help you monitor and debug your integration flows.
Dashboard
The first page you land when navigate to your contract is the Dashboard page. It shows execution statistics, count of flows, count of messages in flows, container errors and memory usage.
Click to expand for more details.
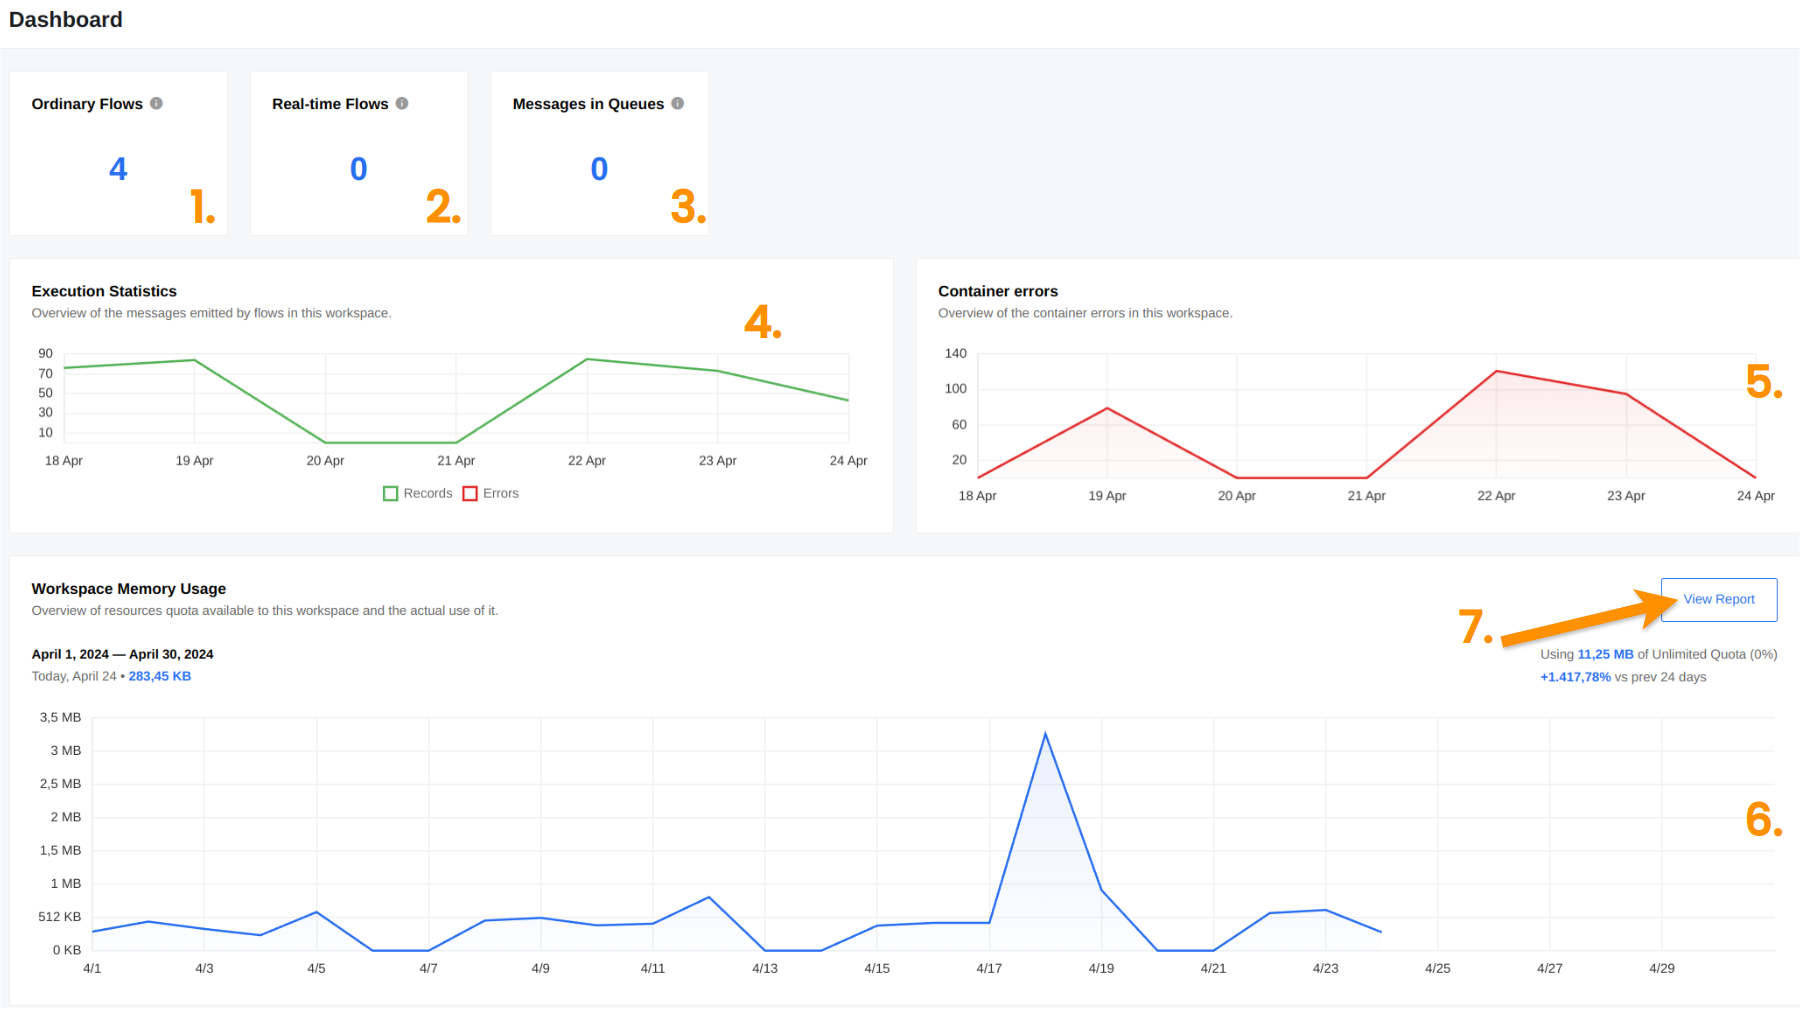
- The Ordinary Flows counter showing the total count of Ordinary Flows in this workspace.
- The Real-time Flows counter showing the total count of Real-time Flows in this workspace.
- The Message in Queues counter showing the total count of messages in the queues in this workspace.
- The Execution Statistics graph showing the overview of the messages emitted by flows in this workspace. You can click on the legend to go the filtered execution information page.
- The Container Errors graph showing the container errors in this workspace. You can click on the legend to go the filtered containers information page.
- The Workspace Memory Usage graph showing the overview of resources quota available to this workspace and the actual use of it. You can hover to the graph point for getting the memory usage for certain date.
- The View Report button that allows you to see the detailed report for memory usage of flows in workspace.
Executions
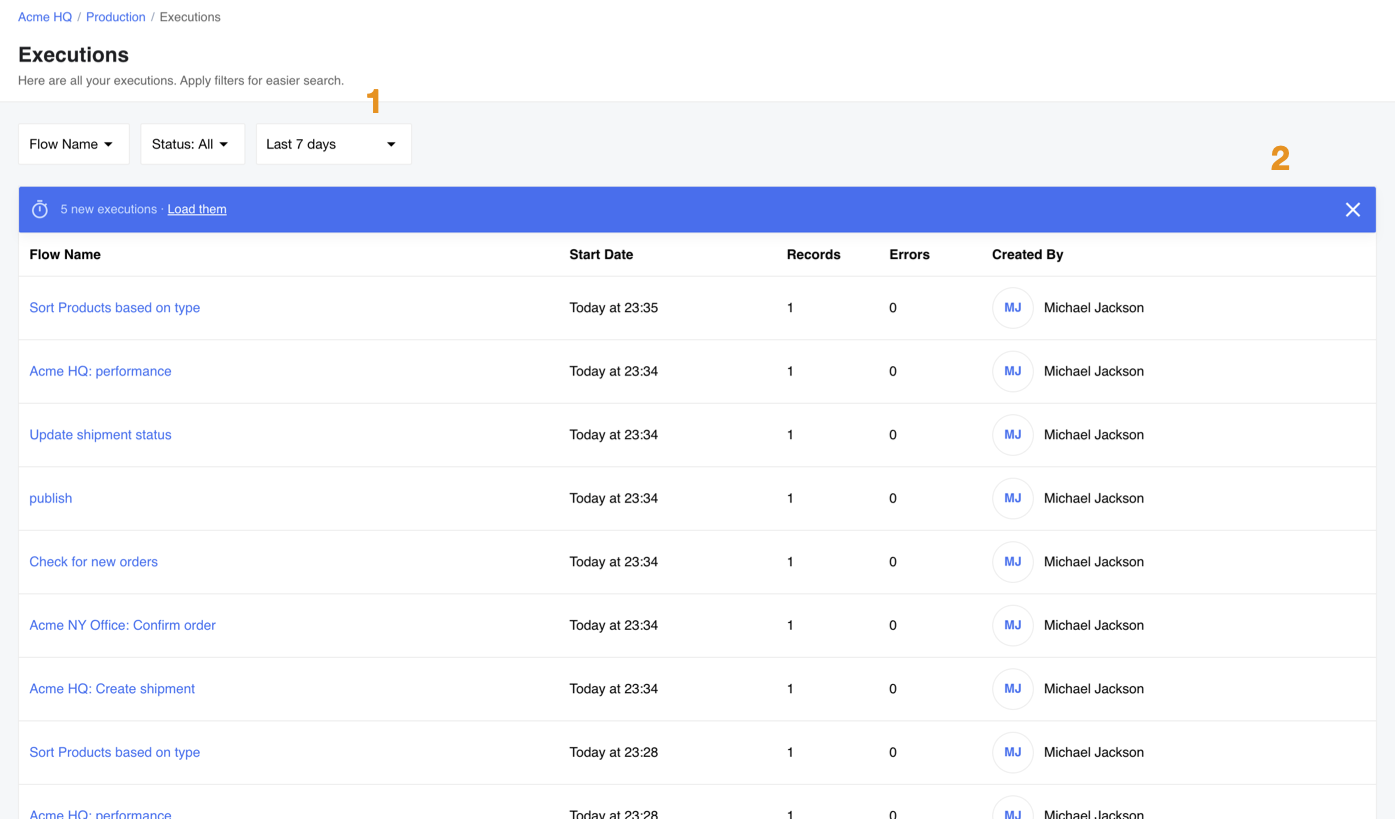
The Executions menu item opens our Executions Page. Here you can find a list of executions based on a data transfer, sort them with filters to narrow down your search and navigate to the one you need.
Click to expand for more details:
- Use filters to narrow down your search based on the Flow Name, Status and the time.
- The list of execution matching the selected criteria.
Containers
The Containers menu item opens our Containers page. This page provides insights into containers and their components. By default, it displays today’s log information, but users can expand the date range using the filtering and search features.
Click to expand for more details.
Container logs are retained for up to 30 days. On the Containers page, you’ll encounter the following states:
- Running - Indicates that the container is currently operational.
- Finished - Indicates that the container has been successfully shut down.
- Finished - Suggests that the container has been stopped due to a registered error.
- Killed - Signifies a successful termination of the container.
- Killed - Indicates that the container was abruptly terminated by the operating system.
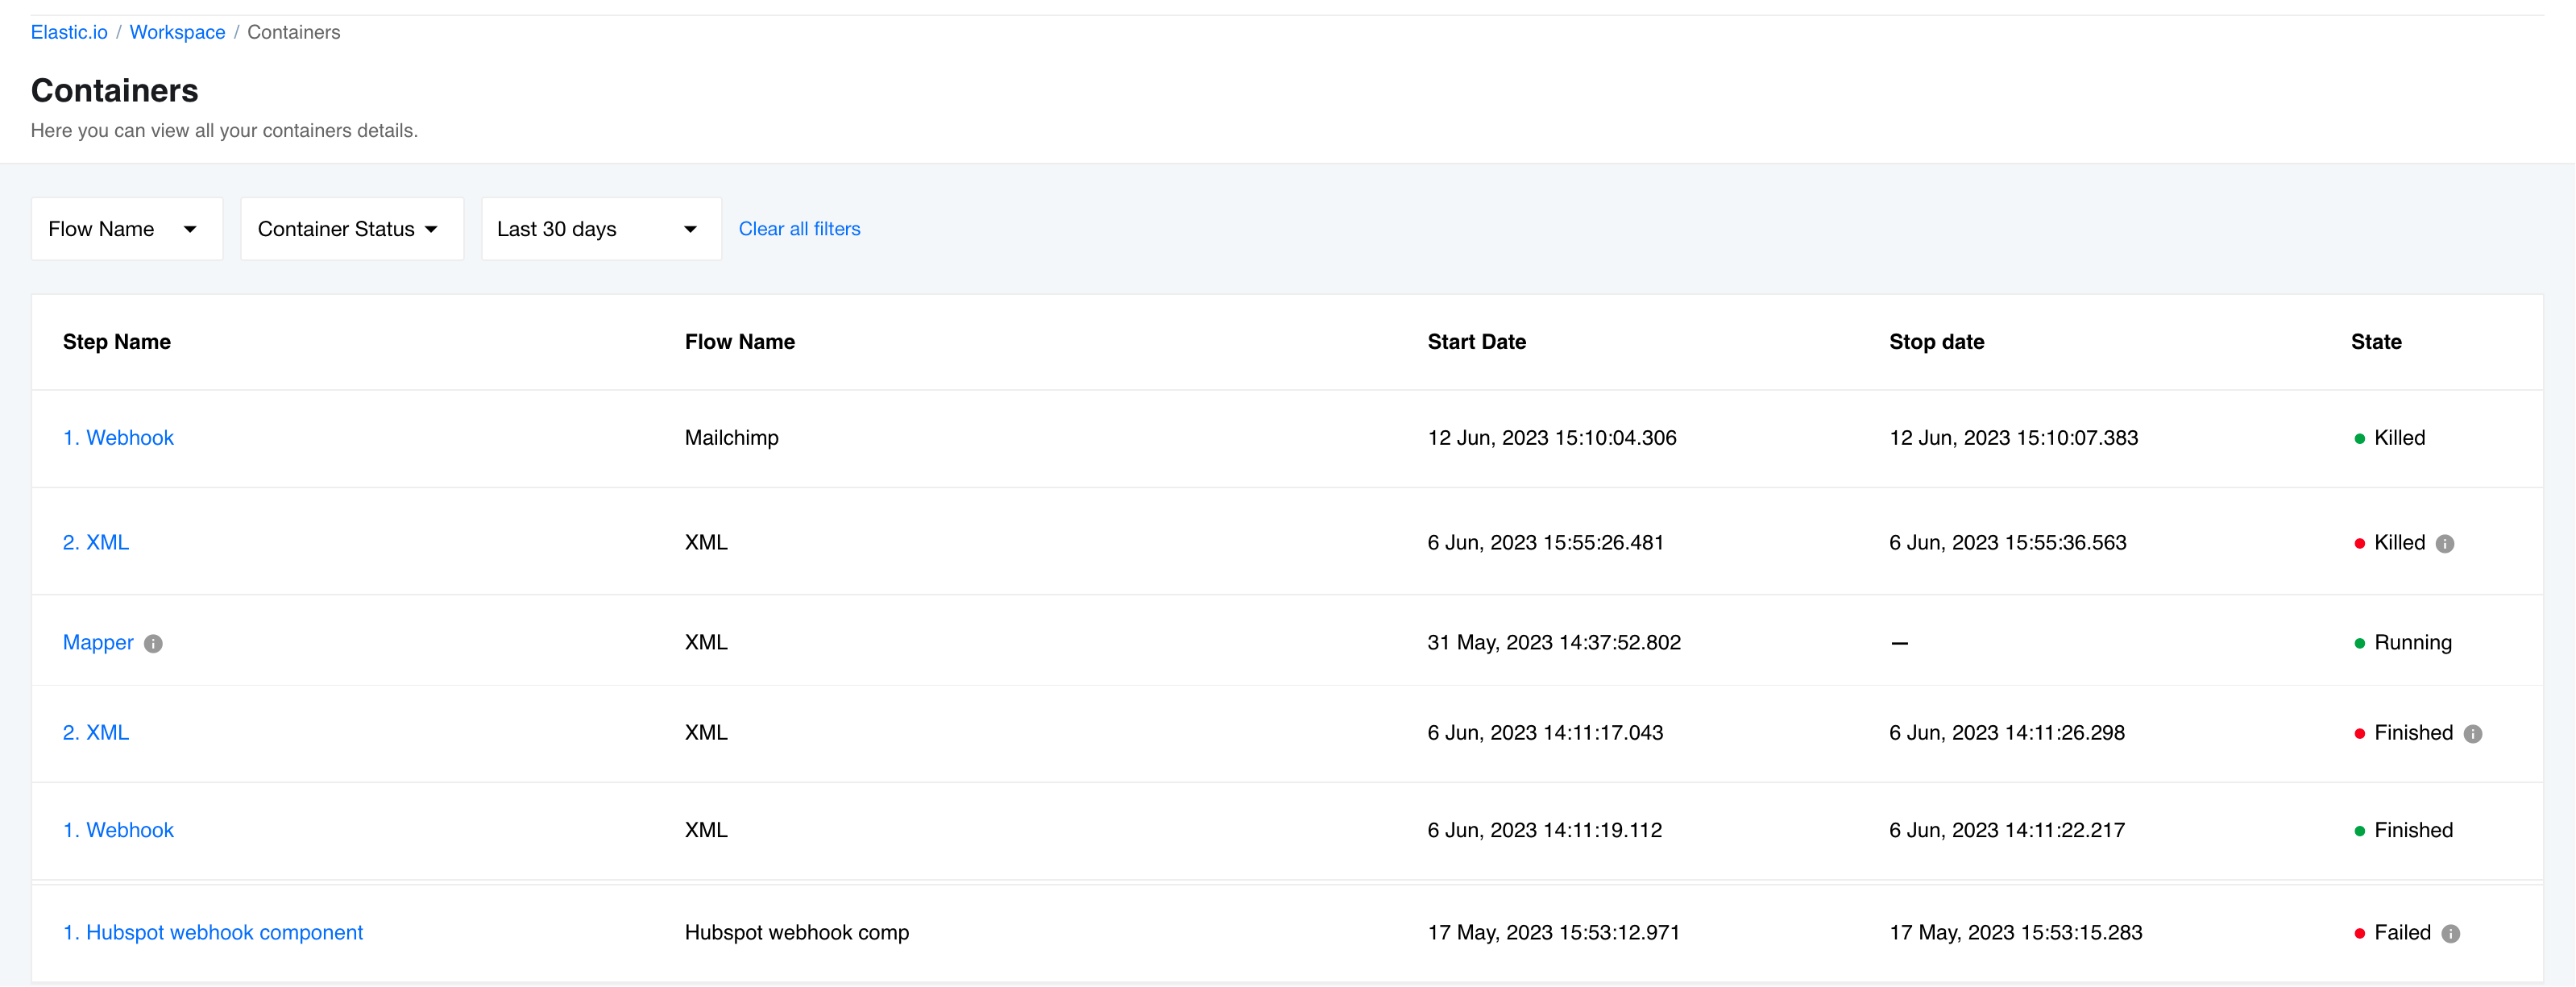
To access specific information for a container, simply click on the ‘Step Name.’ On the individual container page, you will find the following details:
- Status: The current status of the container.
- Flow Name: The name of the flow associated with this container. Clicking on the flow name opens the corresponding flow designer page.
- Start Date: The date and time when the container started.
- Stop Date: The date and time when the container stopped.
- Exit Code: The current or last status code of the container.
- Reason: A description of the current or last status code.
- Filtering: Options for filtering the container’s logs, including Search, Log Level, and Date Range.
- Details: Log entries with Date/Time, Log Level, and Description.

Logs
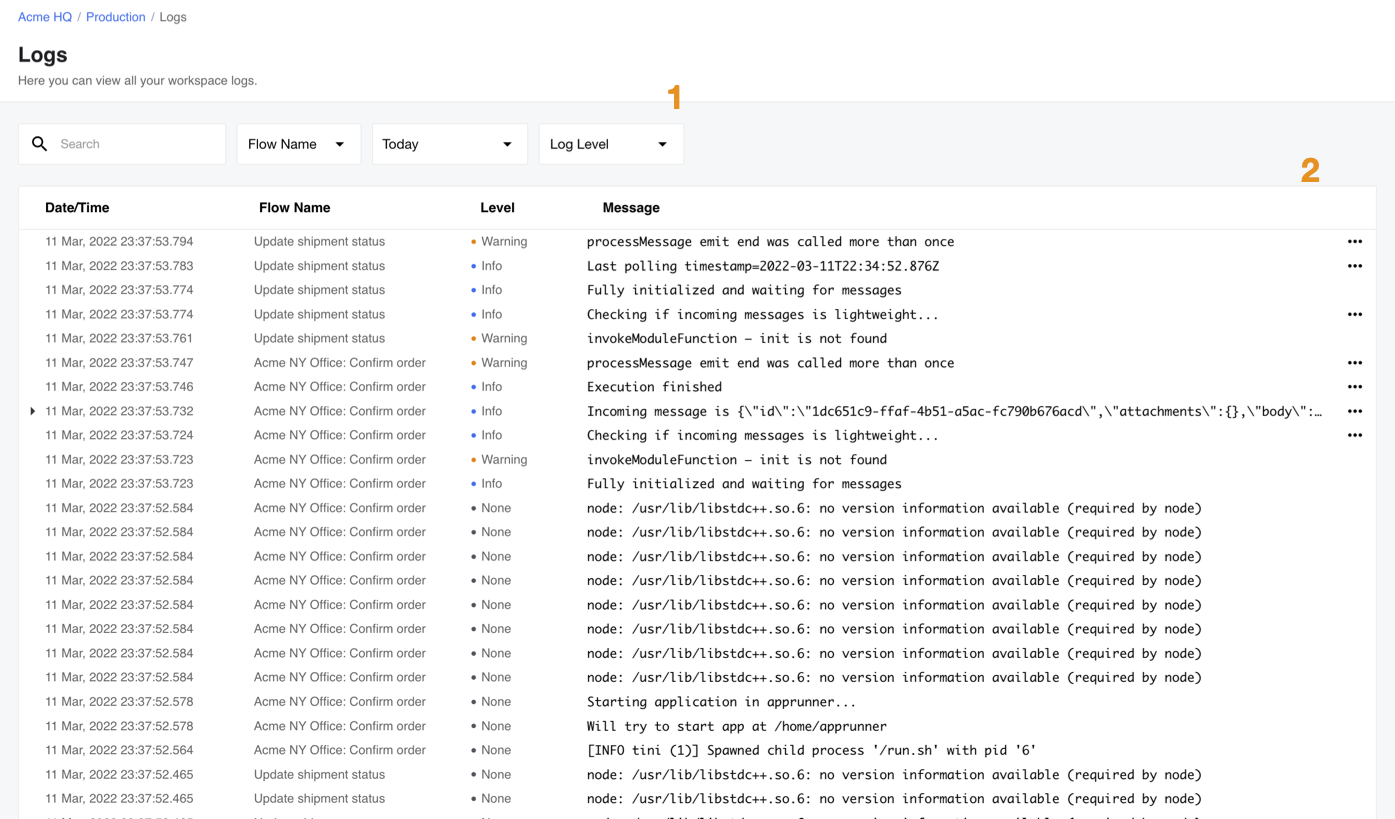
The Logs menu item opens our Logs Page. Here you can find the logs of all executions in your workspace. The view shows logs sorted by time. You can search and filter the logs you are looking for.
Click to expand for more details:
- You can search in the logs and use the filters to find the logs you need.
- The panel shows the logs sorted according to the time-stamp. Here you can click to navigate to the specific execution of the logs (3 dots on the right). You can expand long log entries by clicking on the triangle which will show on the left of the log entry.
4. Integrate
This menu section links the pages you need to build integration flows.
Flows
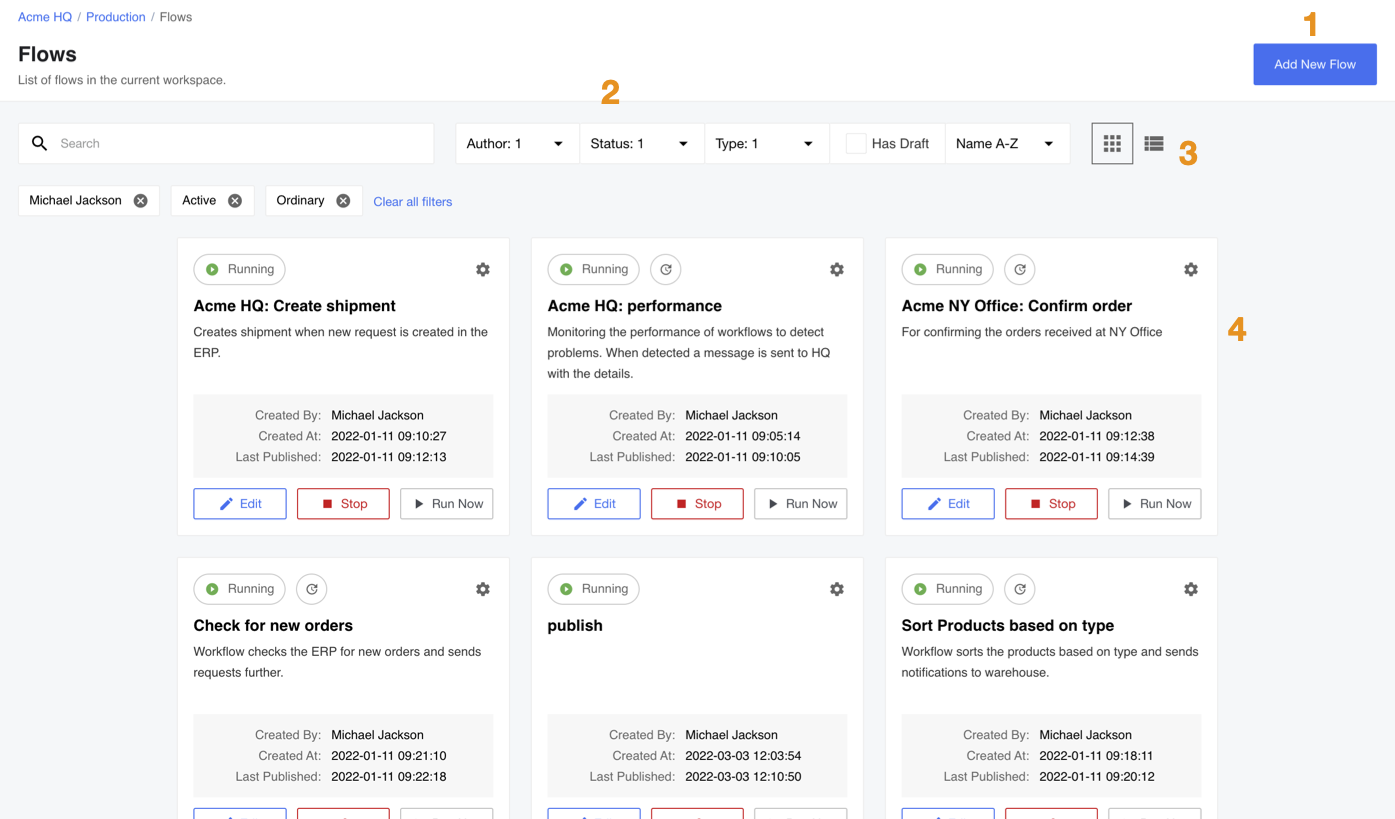
The Flows menu item opens the page where you can manage your integration Flows. From here you can start, stop and edit your existing flows. You can also create new flows either from scratch or by copying and editing the existing flows. From here you can also export flows into different workspaces or create flow recipes.
Click to expand for more details:
- Use the button to Add New Flow.
- Use the free search or provided filters to find the flow(s). You can see the used filters below the search field.
- Use to change the view of flows page between flow cards and list view.
- The Flow card containing information about each flow. You can use the buttons to Edit, Start or Stop flows. You can also use the menu (click on cog icon to open) to Copy and Export the flow, Reset the Snapshot, Subscribe to Errors, Enable Real-time and Delete the flow.
For more information please visit our Managing Flows page.
Credentials
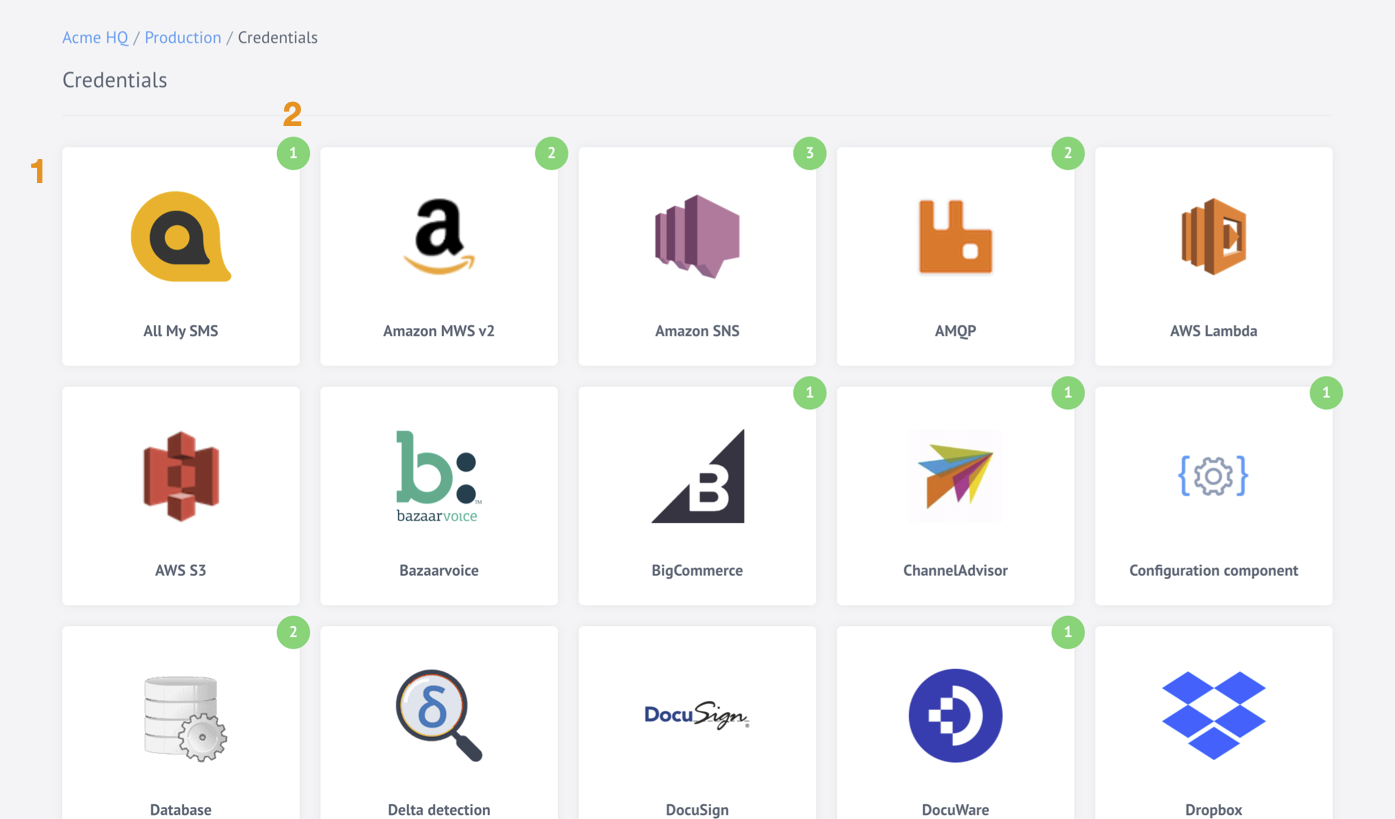
The Credentials menu item opens the page containing component credentials for each component to use for authentication with the 3rd party resources. Here you can create, edit and delete the credentials for each integration component.
Click to expand for more details:
- Here you will find a card for each component which requires a credential to function. Click on any card to navigate to page to Create, Edit or Delete the credentials associated with the component.
- The green number on each credential card shows the number of credentials you have for this component.
Please Note you can also create credentials during the flow step configuration. These credentials will appear on the credentials page as well.
Agents
The Agents menu item links the VPN Agent management page where you can create, edit and delete the VPN Agents. You can use this feature to establish a secure VPN tunnel between your local resource and the platform. This enables a secure data exchange between your local system and the active integration flow.
Click to expand for more details:
- Use to create the VPN Agents.
- The list of VPN Agents configured for your workspace.

Topics
The Topics menu item opens the Topics management page. Here you can create, edit and delete your Topics. You can use this feature to establish a publish-subscribe messaging pattern to exchange data between the integration flows.
Click to expand for more details:
- Use the Create button to create a new topic.
- The existing topic cards. Click on them to Edit or Delete them.

Recipes
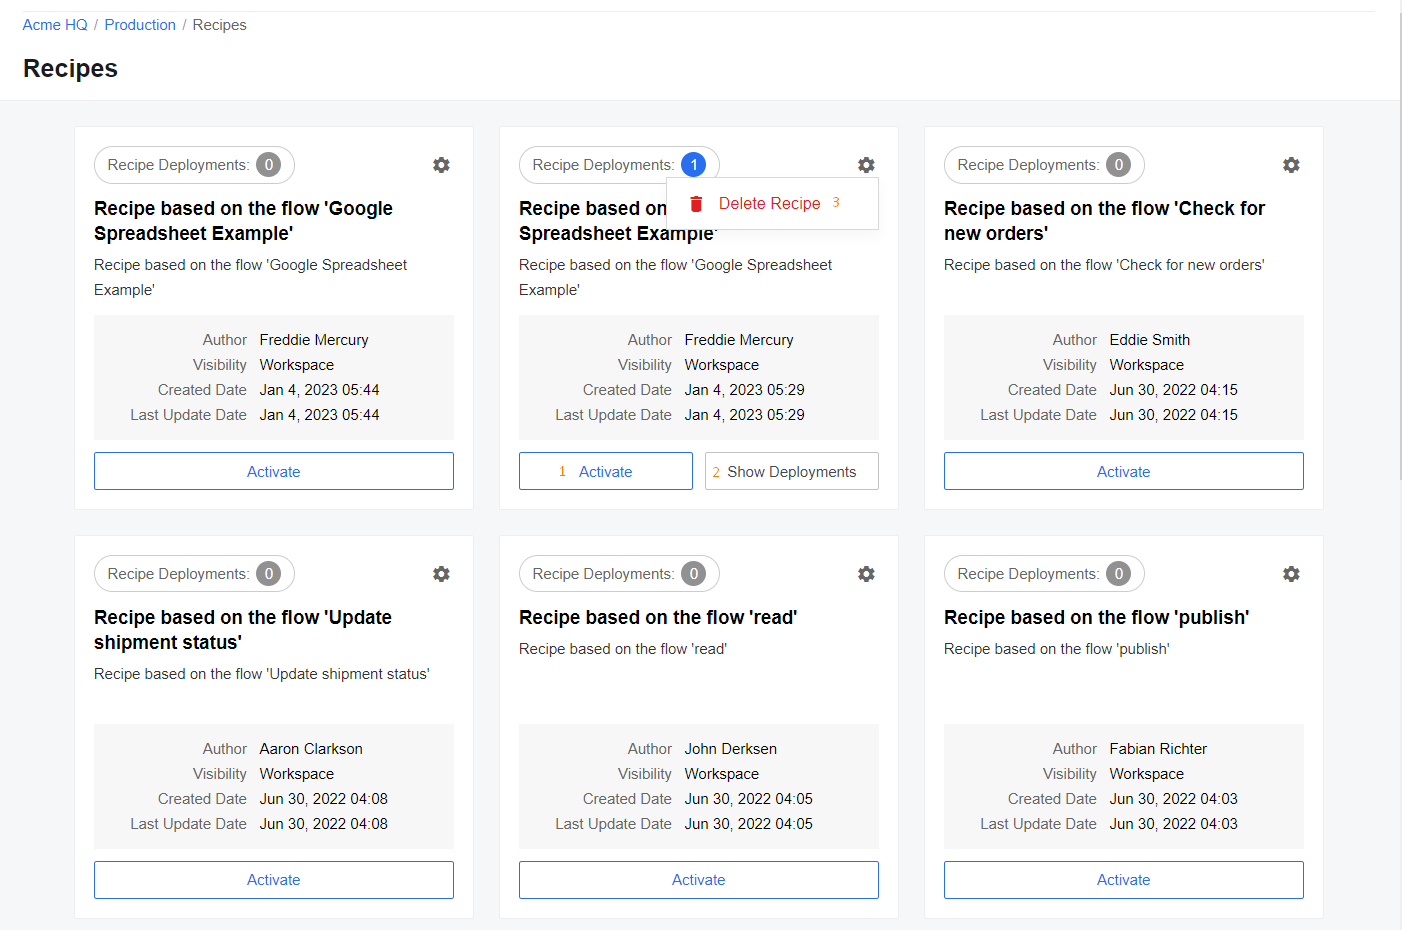
The Recipes menu item opens the Recipes management page. Here you can activate and delete your Recipes. We also display the number of deployments of these recipes on each Recipe Card. Recipes allow users to share Flow templates with others without disclosing their non-shareable data (Credentials, Fields, Variables).
Click to expand for more details:
- You can deploy running integration flows from any listed Recipe by hitting the Activate button.
- Each deployment can include more than one integration flows and these we display when you click Show Deployments on the Recipe Card.
- You can also Delete any Recipe.
5. Organize
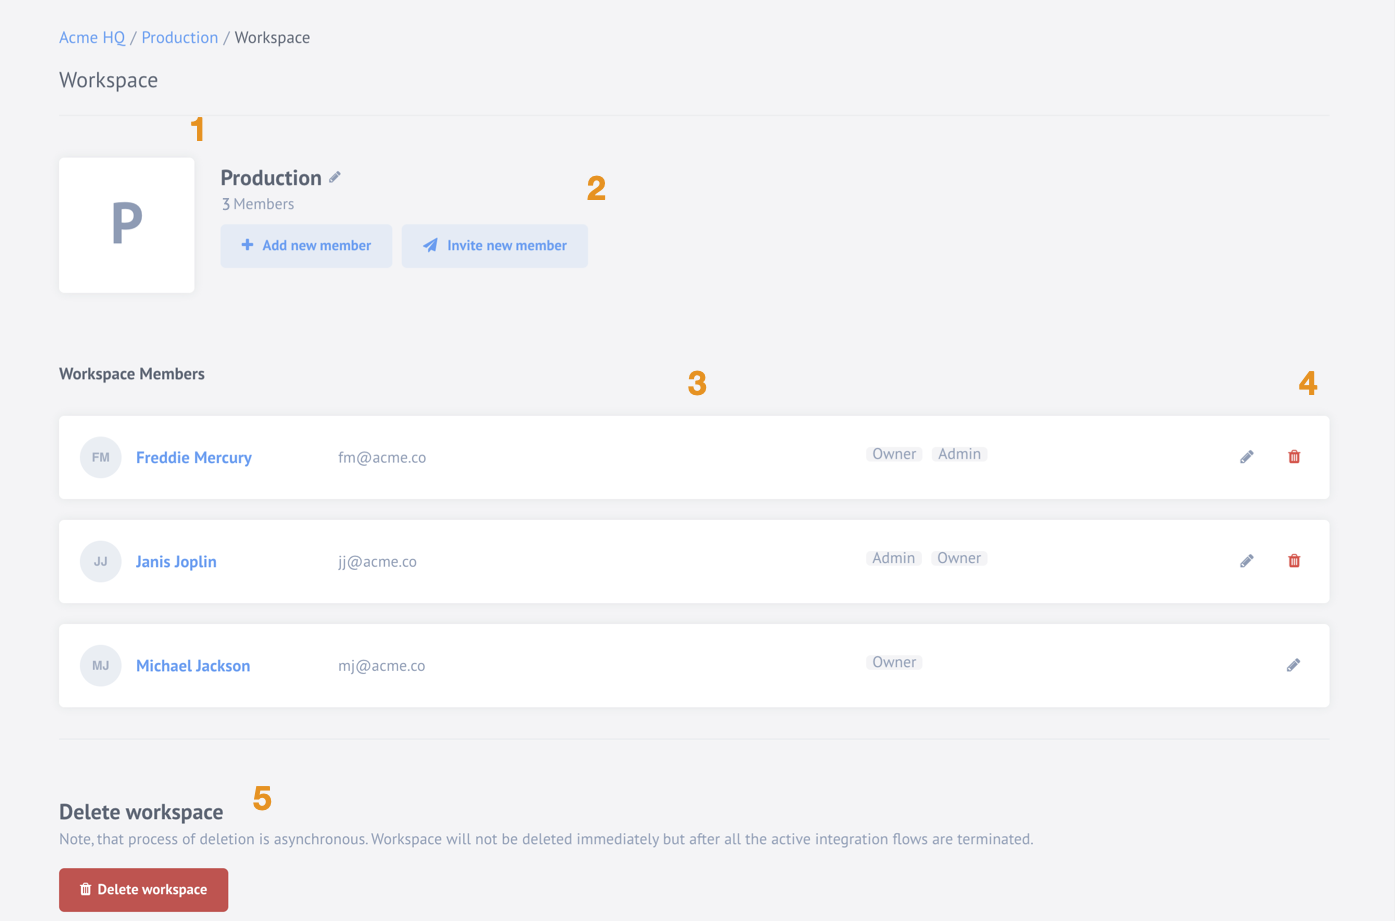
This menu section has one item - the Workspace which opens workspace management page. Each workspace has a separate page like this where you can rename it, manage members and delete it based on your access role.
Click to expand for more details:
While in workspace management page you can:
- Rename the workspace.
- Add or Invite new member to this workspace.
- See the list of workspace members.
- Edit member roles or remove them completely.
- Delete the workspace.
For more information please visit our Managing Workspaces page.
6. Contract Settings
This menu section includes the following items:
Quota Usages
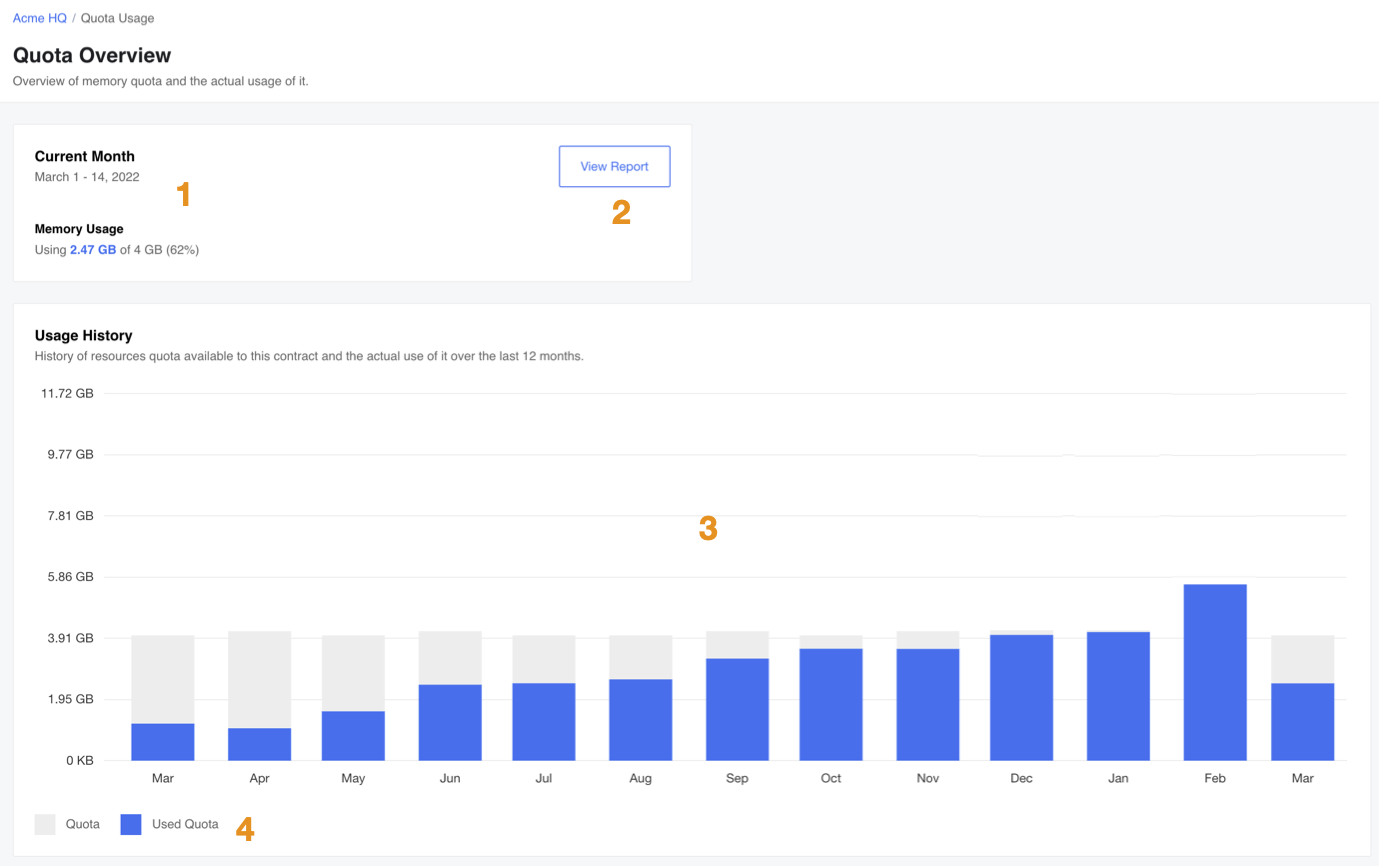
The Quota Usages menu item opens our quota overview page. Here you can check the combined memory usage of flows in all your workspaces of the contract. From here you can drill-down the usage based on the workspaces and individual flows for the current month. If you have the memory quota limit set for your contract then you will see relationship of used and still remaining quota.
Click to expand for more details:
- Shows the current month and the current usage. It also shows the quota limit if defined.
- Use the button to drill-down into the workspace and flow level usage.
- The histogram of the used memory per month. If the contract has a quota limit then histogram shows the used memory and the still remaining quota. You can hover on any month to get the exact values.
- The legend for the histogram.
Members
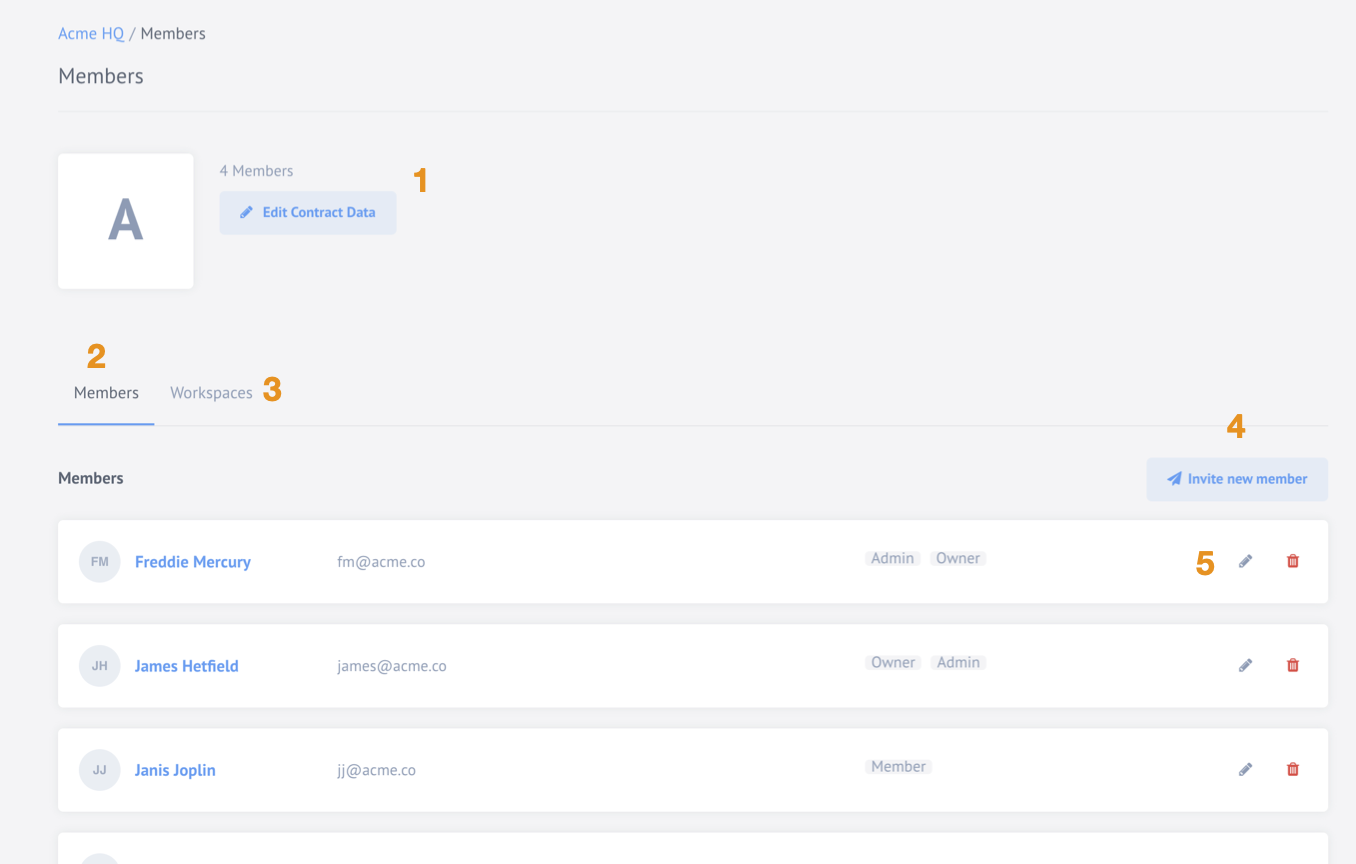
The Members menu item opens the contract Member management page. Here you can rename the contract, view and invite members, edit the member access roles or remove the member from the contract. From this page you can access Workspaces page as well.
Click to expand for more details:
You can do the following action if you have Owner role in the contract.
- Rename the contract.
- The list of members in current contract.
- Workspaces switcher to open page with all workspaces.
- Invite new member button to invite new member to this contract based on your role in this contract.
- Pencil icon to use for managing the user roles and bin icon to delete the user.
Workspaces
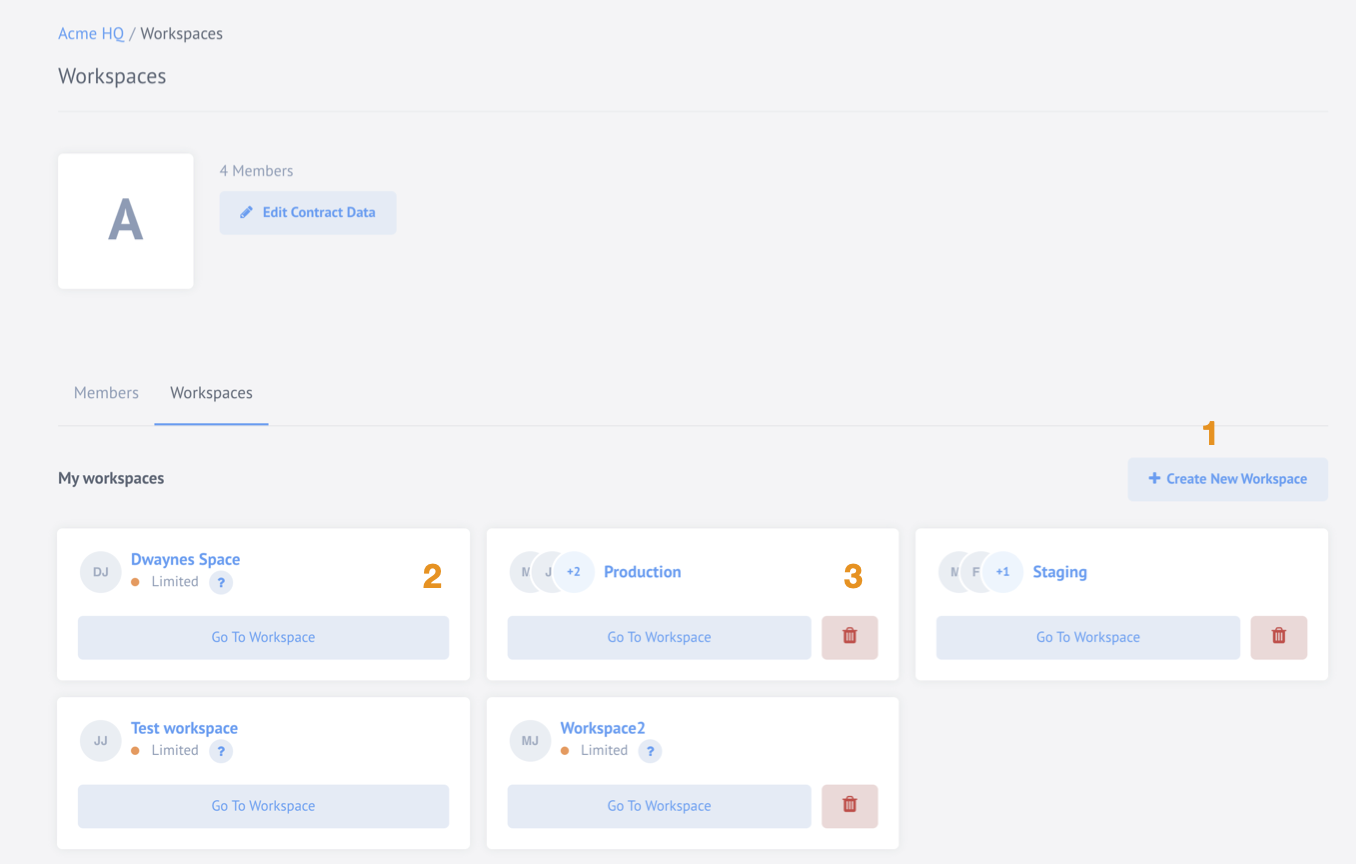
You can access this page from the Workspaces tab of the Members page or from the View all workspaces menu link of the Workspaces name. Here you can manage the workspaces of this contract. You can create a new workspace, see all existing workspaces and navigate to each workspace if you have appropriate access and role in the contract.
Click to expand for more details:
- Click on + Create New Workspace button to create new workspace.
- See the existing workspace cards showing the name, type and number of users.
- Delete the workspace by pressing on bin icon. Warning: this action is irreversible.
For more information please cvisit our Managing workspaces page.
7. Development
This menu section includes items for component developers. Here you have a link to the following pages:
Developer Teams
The Developer Teams menu item opens the contract developer teams page. Here you
can manage your existing teams and integration components or
create a new ones if your have contract Admin access role.
Click to expand for more details:
- Use Add New Team button to create a new developer team.
- Here you can see the developer team details, number of members and repositories it contains. Click on the Name to navigate to any developer team.

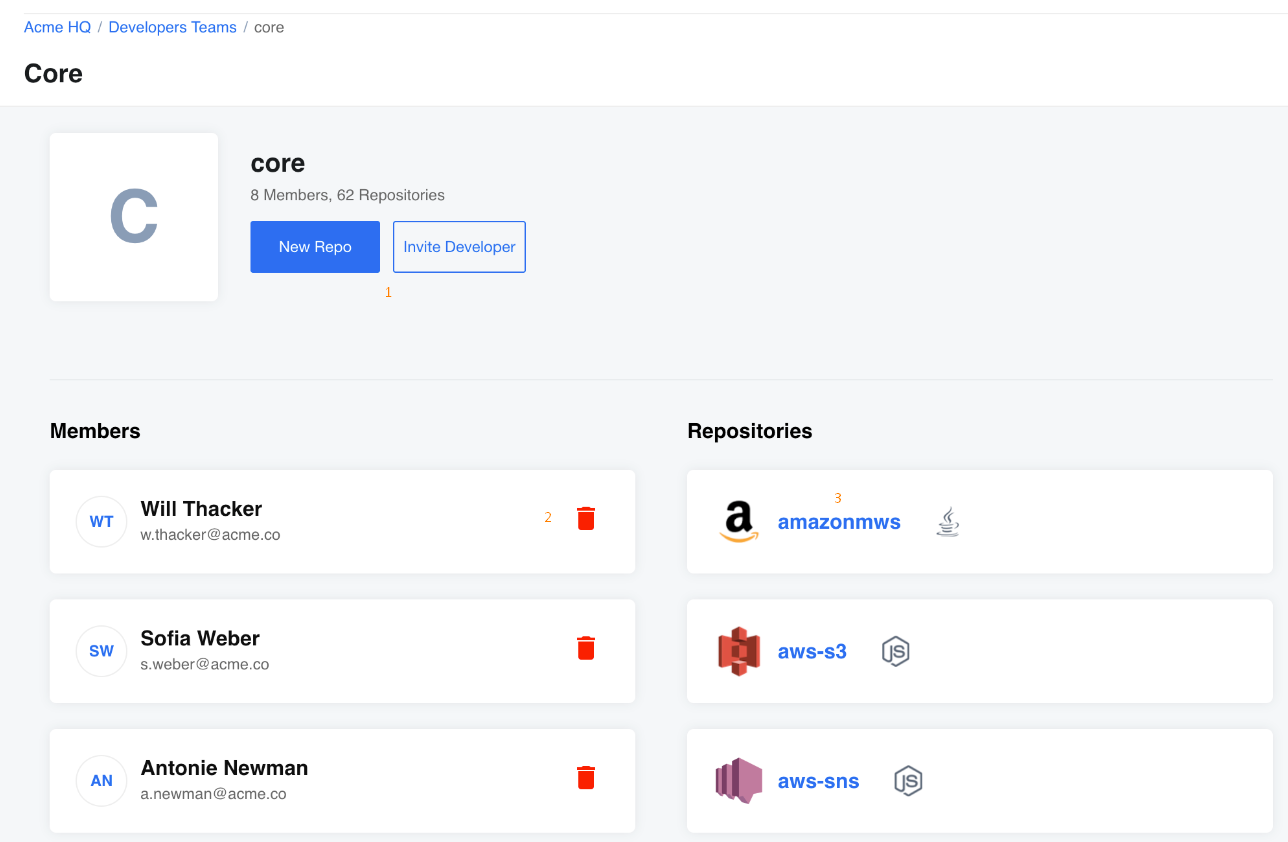
If you clicked on the team name, you will see the functionality to manage your team:
- Create a new repositories or invite new members.
- Delete member of the developer team.
- See details on repositories.
Metadata Test Tool
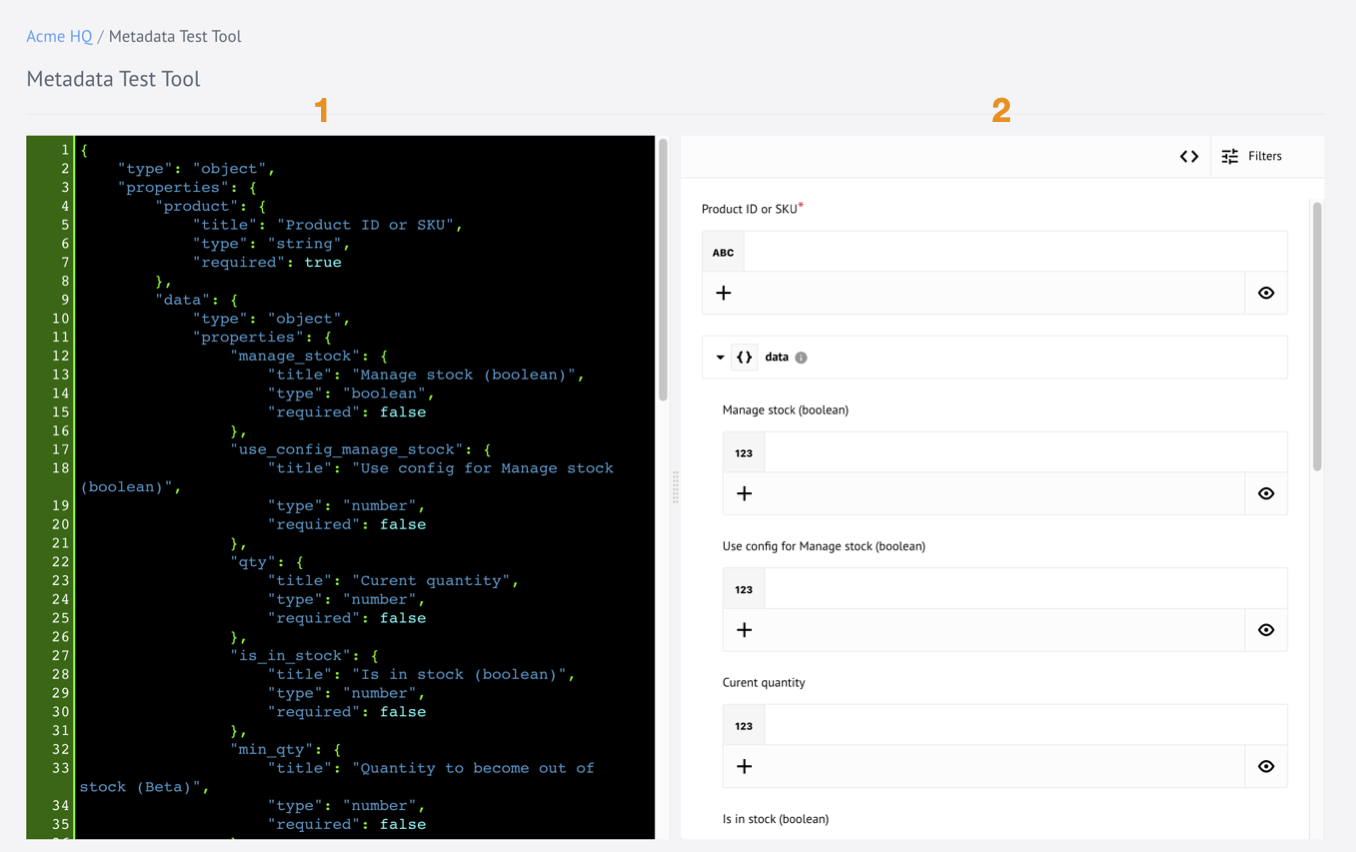
The Metadata Test Tool menu link opens a special tool our developers use to test and improve the component metadata structures. You can paste your metadata here to see how it renders on the platform UI.
Click to expand for more details:
- The panel you can use to paste the JSON structure of your metadata.
- The panel renders the output based on your input data.
